

welcome to my world :)
Marketing reporting
Your numbers should help you decide what to do next.
The work before
A team’s posts and performance were spread across accounts. A useful review meant bringing the numbers together, checking what was actually published, finding the examples, and making a report people could read.
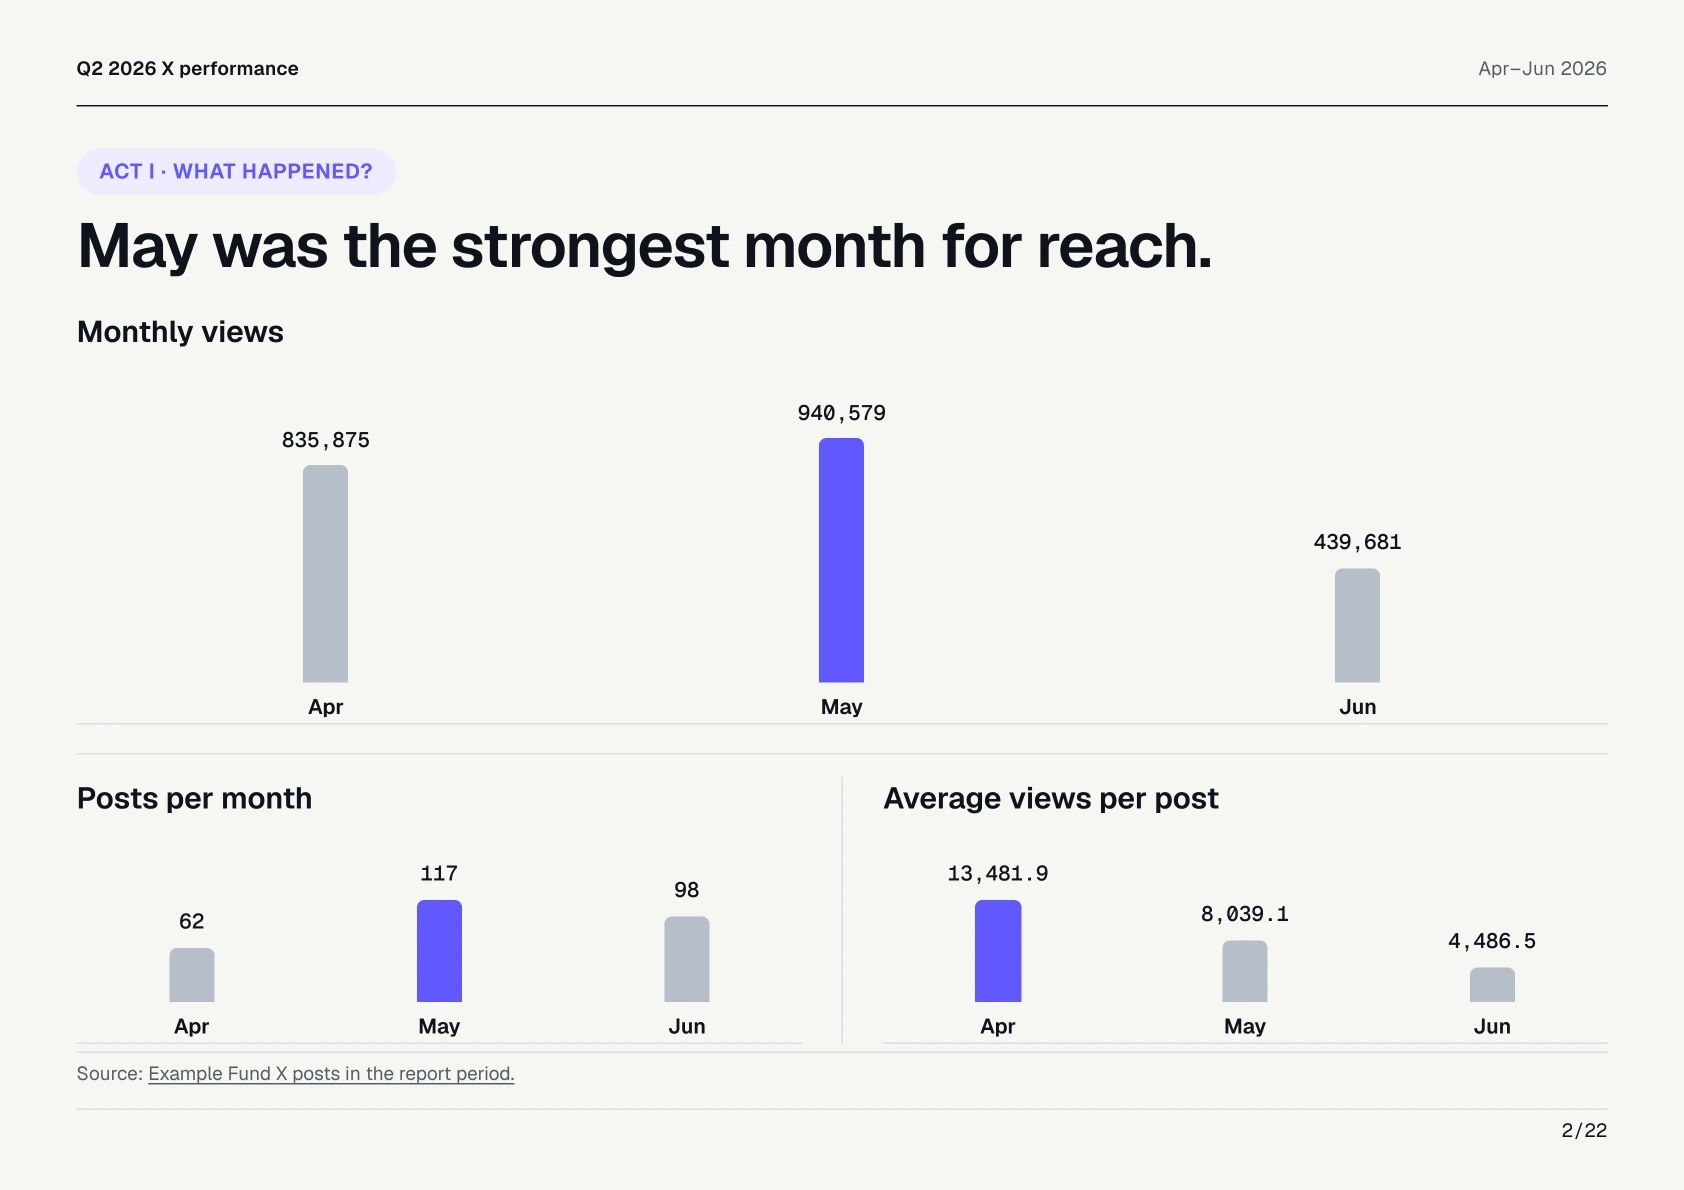
I built a system that does that preparation and produces a weekly content board, a rolling review, and quarterly reporting slides.
What I built
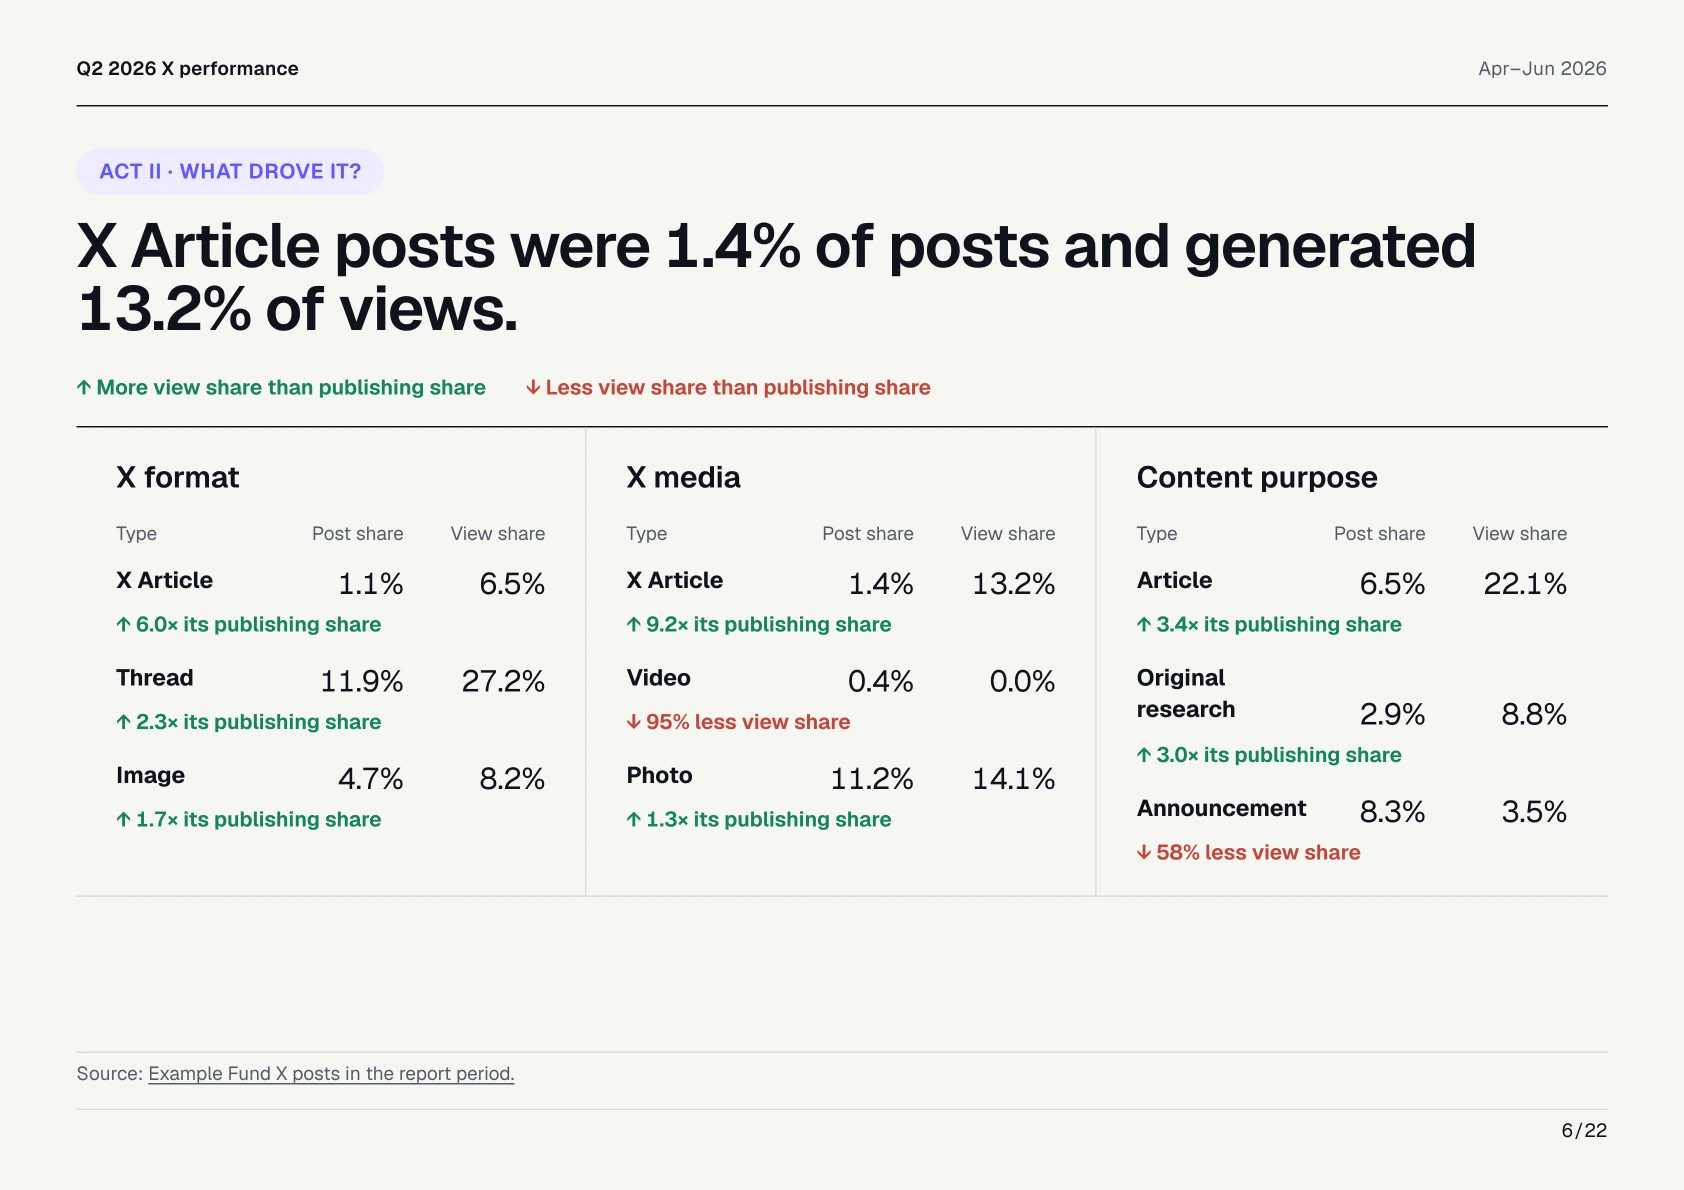
The workflow brings together social performance data, classifies the content, and calculates the comparisons in code. It keeps views, comments, shares, saves, and publishing activity separate, so the report can explain what each number means.
The same research supports a team board in Notion and a designed quarterly report. Each finding connects back to its supporting posts, with coverage and missing data made explicit.
What changes
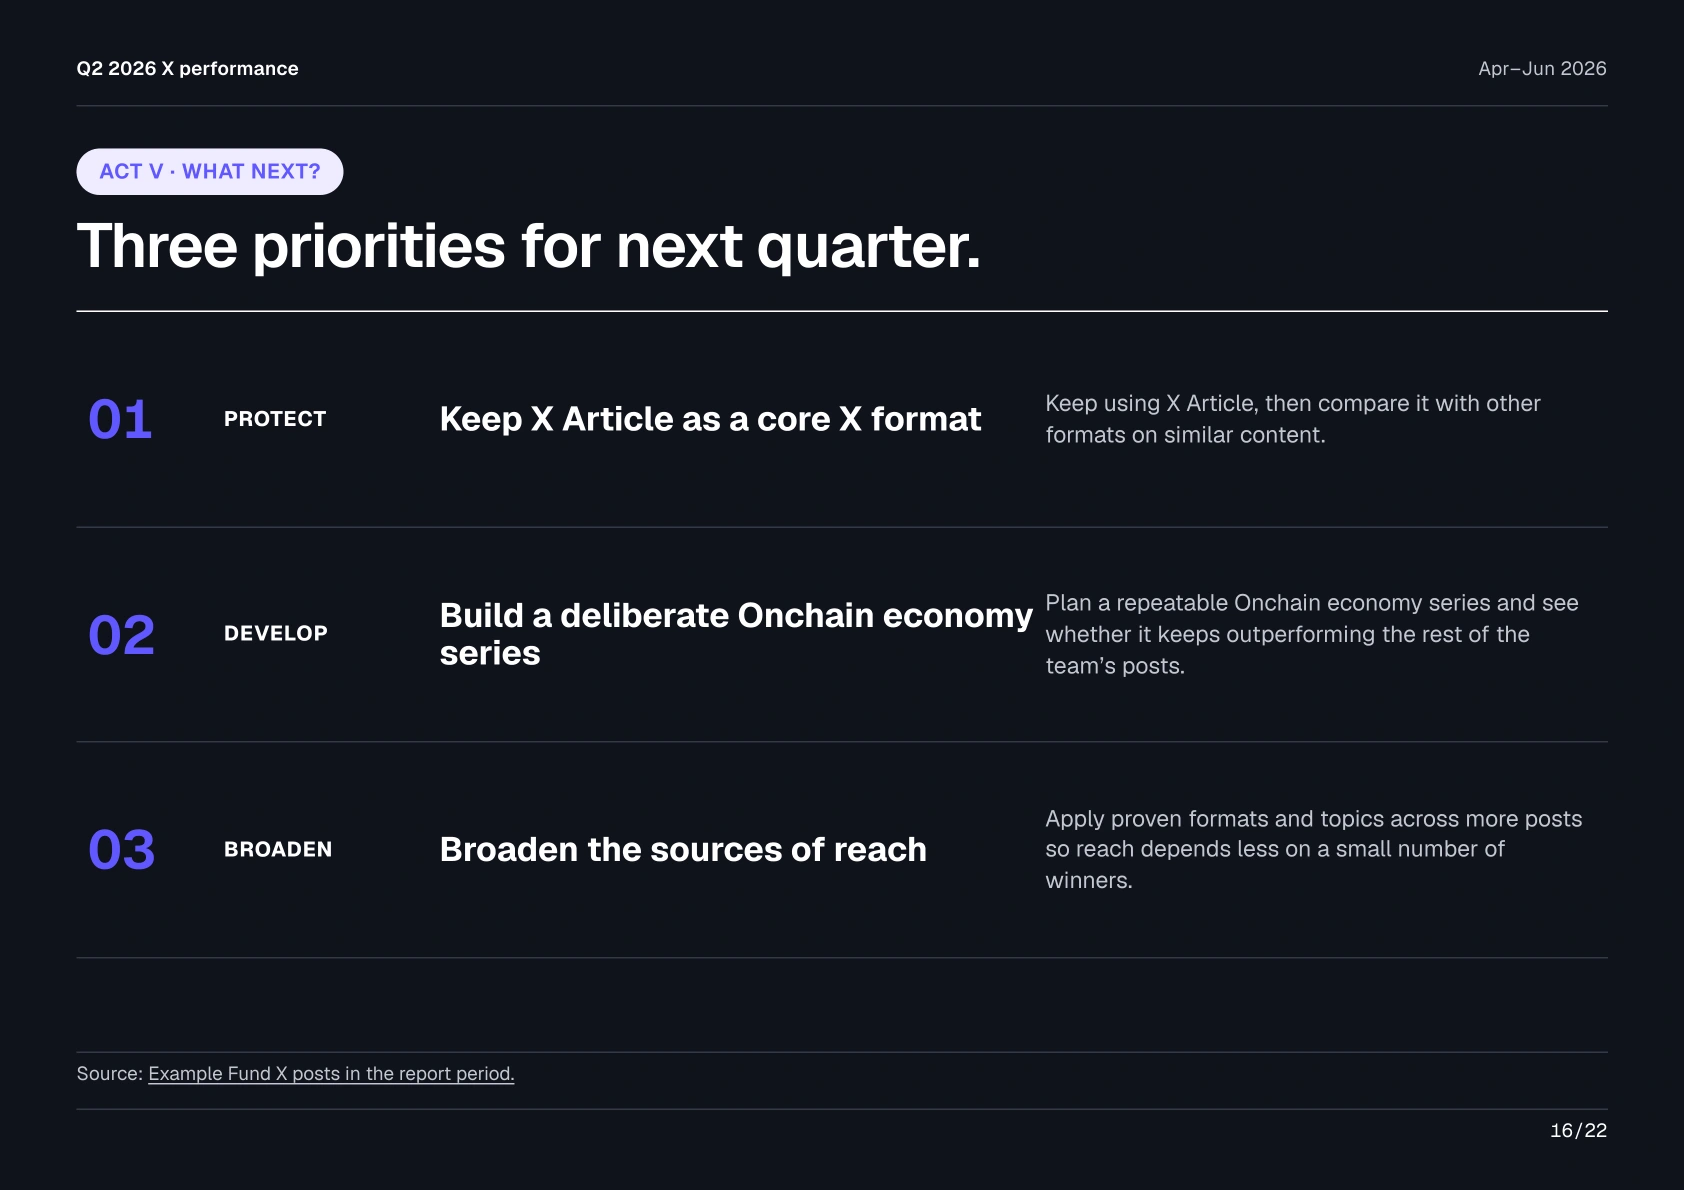
The team gets a consistent review: what happened, which content and people contributed, and what to protect, change, or test. The source material is there when someone wants to question a conclusion.
A person still reviews the interpretation and decides what to publish next.
Talk to me about your reporting